|
|
|
|
|
|
|
|
|
|
|
|
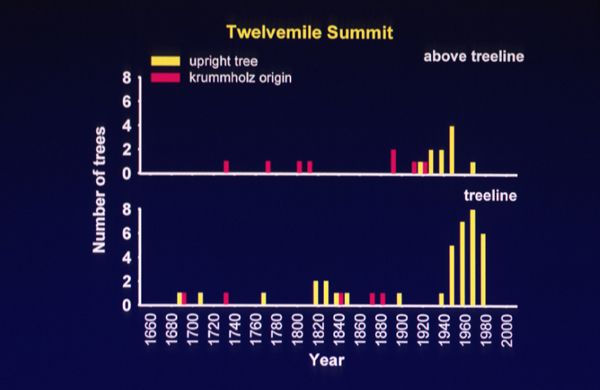
From the graph above, it appears that growth form may be changing over time. In recent times (around 1960), trees have been growing more upright than in the past (from 1700 to 1960). This is interesting because the climate in the area has also gotten warmer since trees have been growing more upright. Read the graph: Start with the top graph-- above treeline. The y-axis shows number of trees, and the x-axis shows the year each tree started growing. For instance, at about 1730, one tree started growing above treeline. But the graph shows more: the two colors show different growth forms. Yellow shows upright (straight) trees, while pink shows twisted krummholz trees. Notice at above treeline that most of the trees from 1730 to 1910 have been twisted krummholz, and that most of the trees since then have been growing upright. Now read the treeline graph underneath the same way: a scattering of both growth forms (shown in yellow and pink) from 1700 to 1900, then only upright (shown in yellow) growth forms. Again, this change in growth form has happened roughly around the same time as an increase in temperatures for the area. A note of caution: this graph is only from one site. In order to feel more confident in these results, we need to look at many other sites (called replication). See Below! (Another word of caution: the graph does not use the growth forms of the young trees-- only the older ones.) 
|
|
|
|
|
All Rights Reserved (R) Middlebury College Biology, 1999, 2000