|
|||||||||
|
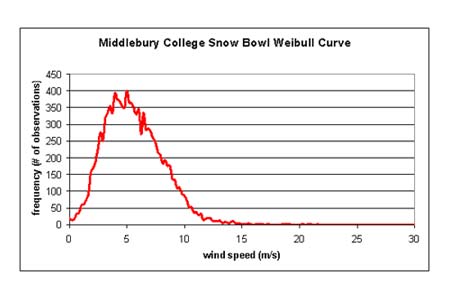
WEIBULL CURVE A Weibull Curve is a wind speed frequency diagram that illustrates how often the wind blows at a certain speed. The shape of this frequency diagram is a large determinant in the annual power output of a wind turbine. Shown below is the Weibull Curve for the Middlebury College Snow Bowl. Statisticians refer to the shape of this curve as a Rayleigh Distribution, also referred to as a Weibull Shape Parameter of 2 in the wind industry. This frequency distribution is also characteristic of much of northern Europe.
|
||||||||